A company's growth potential can be determined by its NPS score. If the Net Promoter Score® increases, the potential also increases. The reason for this is understandable, the more satisfied your customers are with your company, the more likely it is that more sales will be made and more customers will come to you through recommendations.
However, it is very important to note that the goal of an NPS campaign is not to get statistically great NPS scores. If the NPS data obtained is analyzed correctly, it enables in-depth insights into customer sentiment.
The problem that arises here is not only that the compilation and the moment of the survey must be chosen correctly, it also requires some experience to correctly evaluate the collected data.
In this article we give you helpful tips on how to correctly analyze the survey data from your NPS campaigns.

Table of Contents
- Understand the NPS analysis correctly.
- Take a close look at the NPS distribution
- Determine the best channels for your survey.
- Put the focus on customer loyalty
- Conduct a sentiment analysis
- Do a text analysis
- Take the feedback analysis seriously and act on it
- Monitor customer satisfaction at every touchpoint of the customer journey.
- Check what engagement metrics your customers define
- NPS analysis made easy - with Callexa
Understand the NPS analysis correctly.
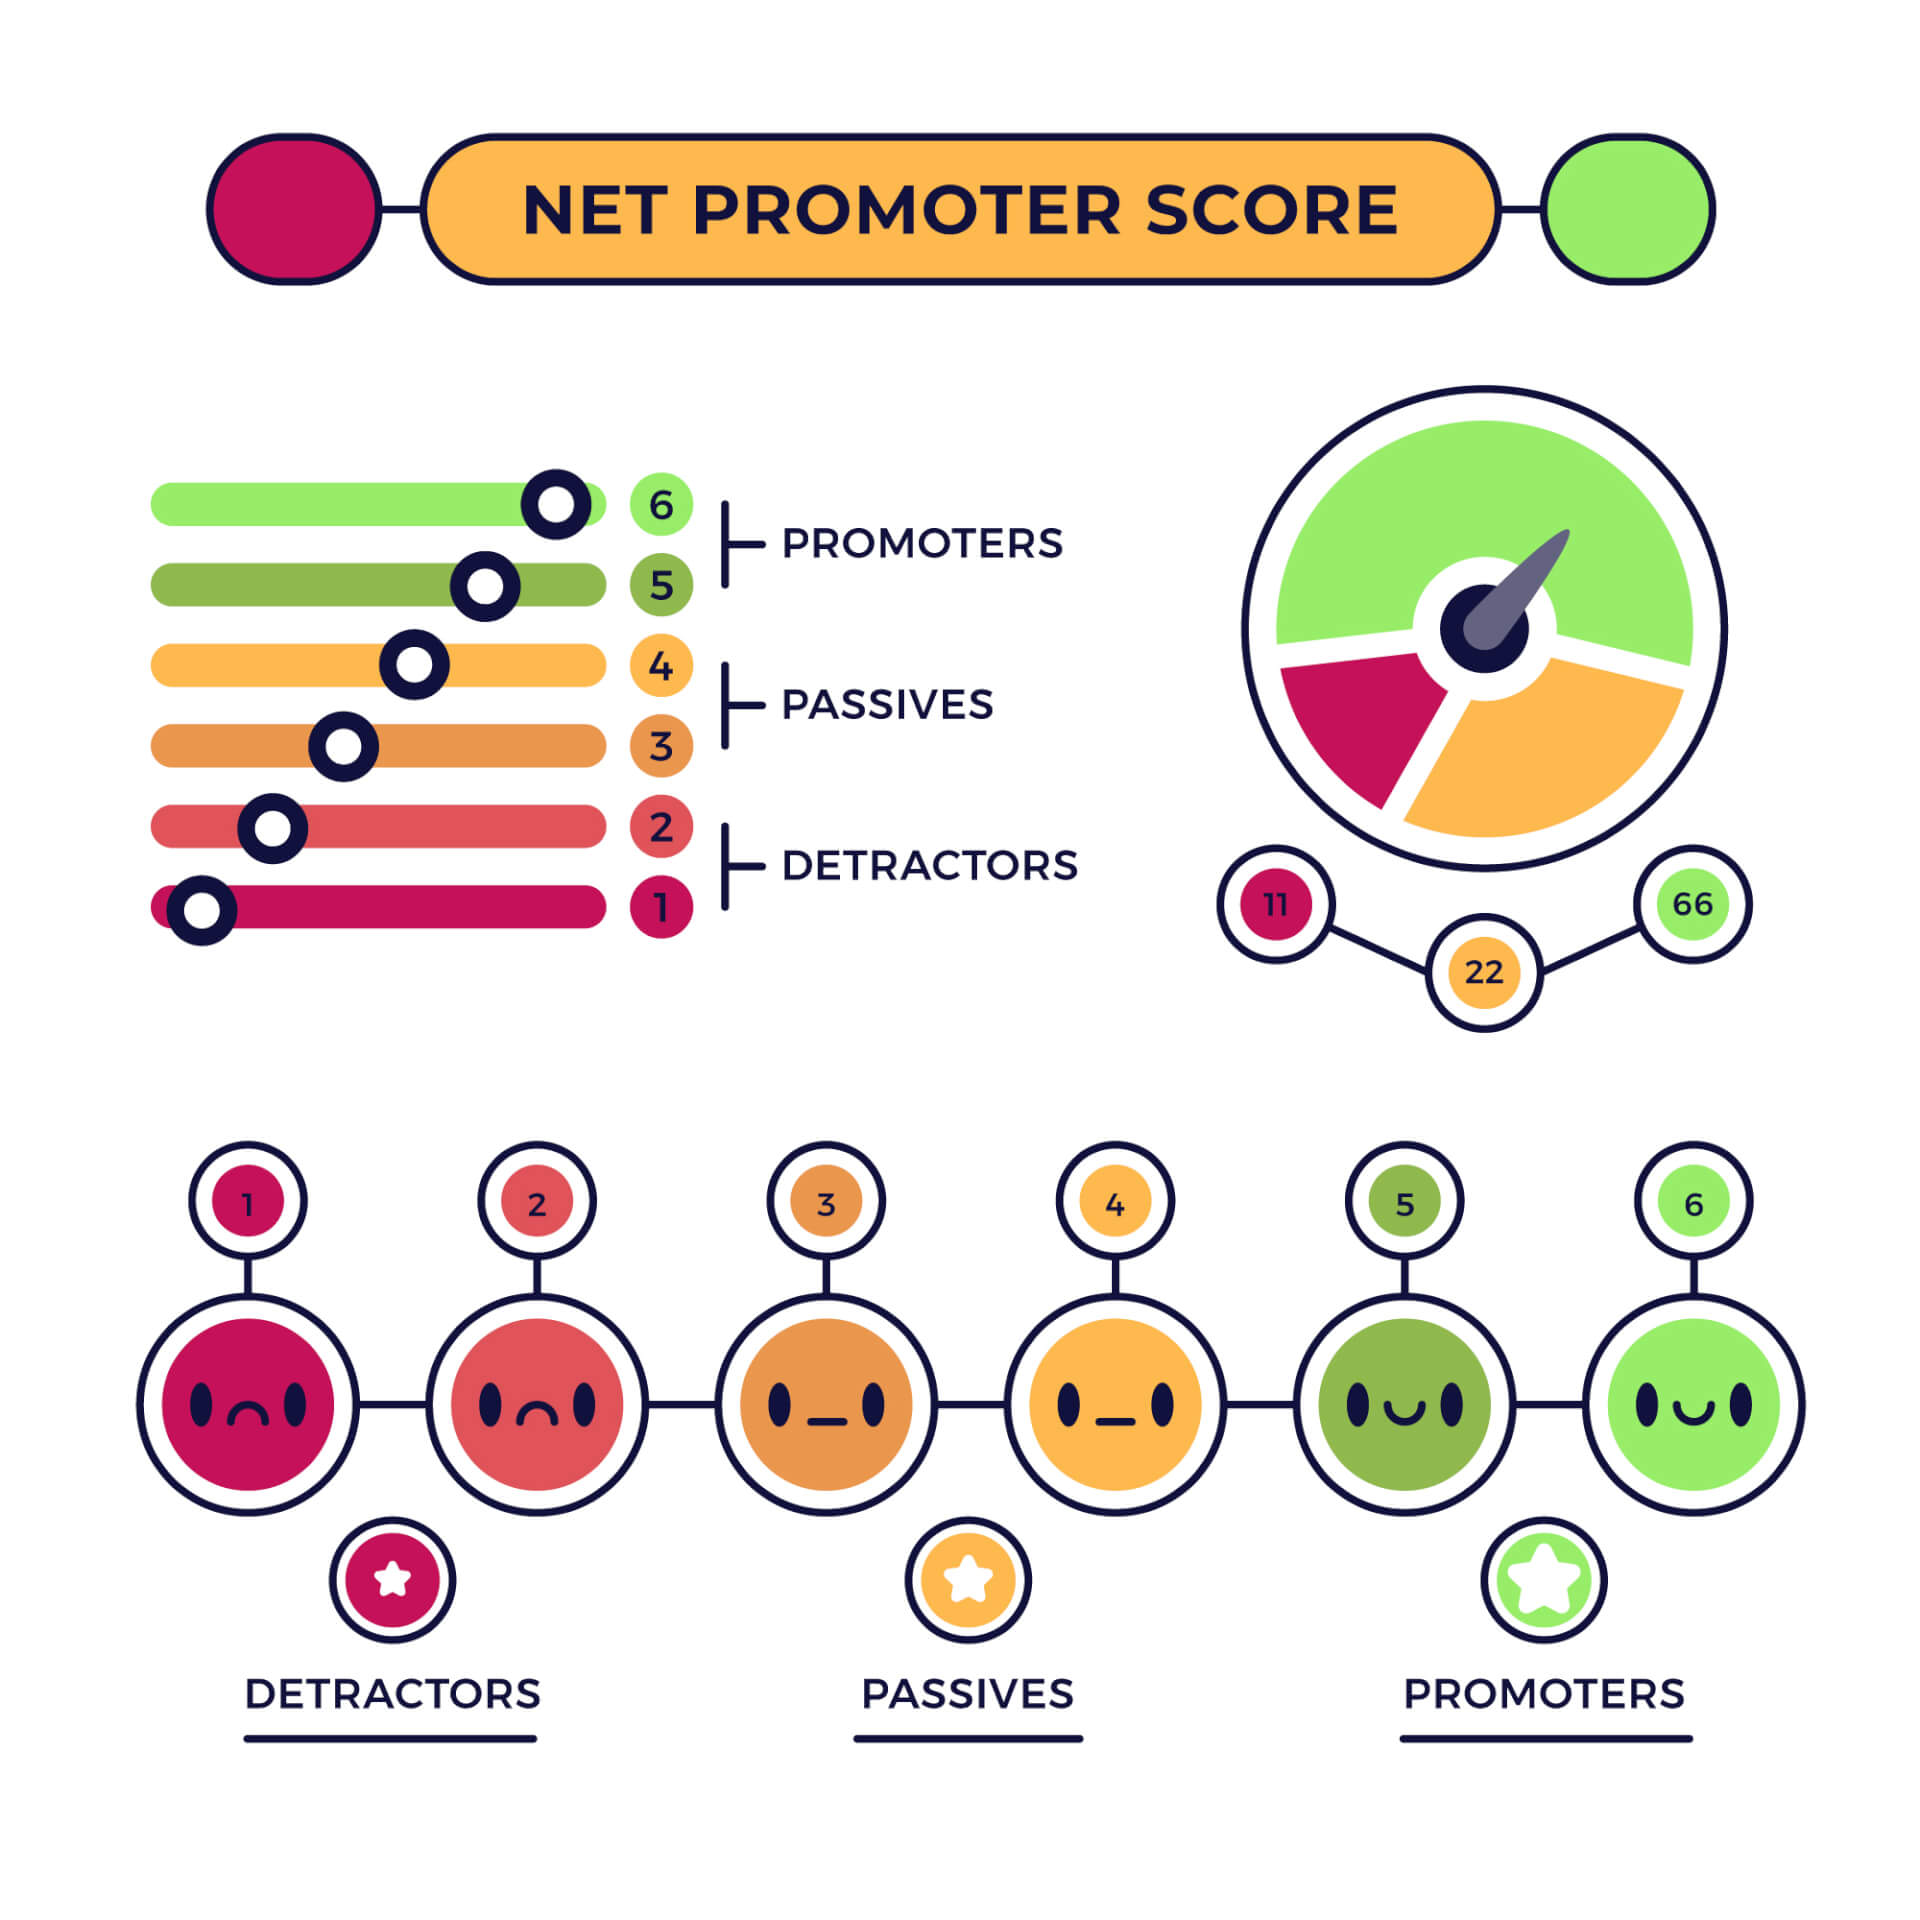
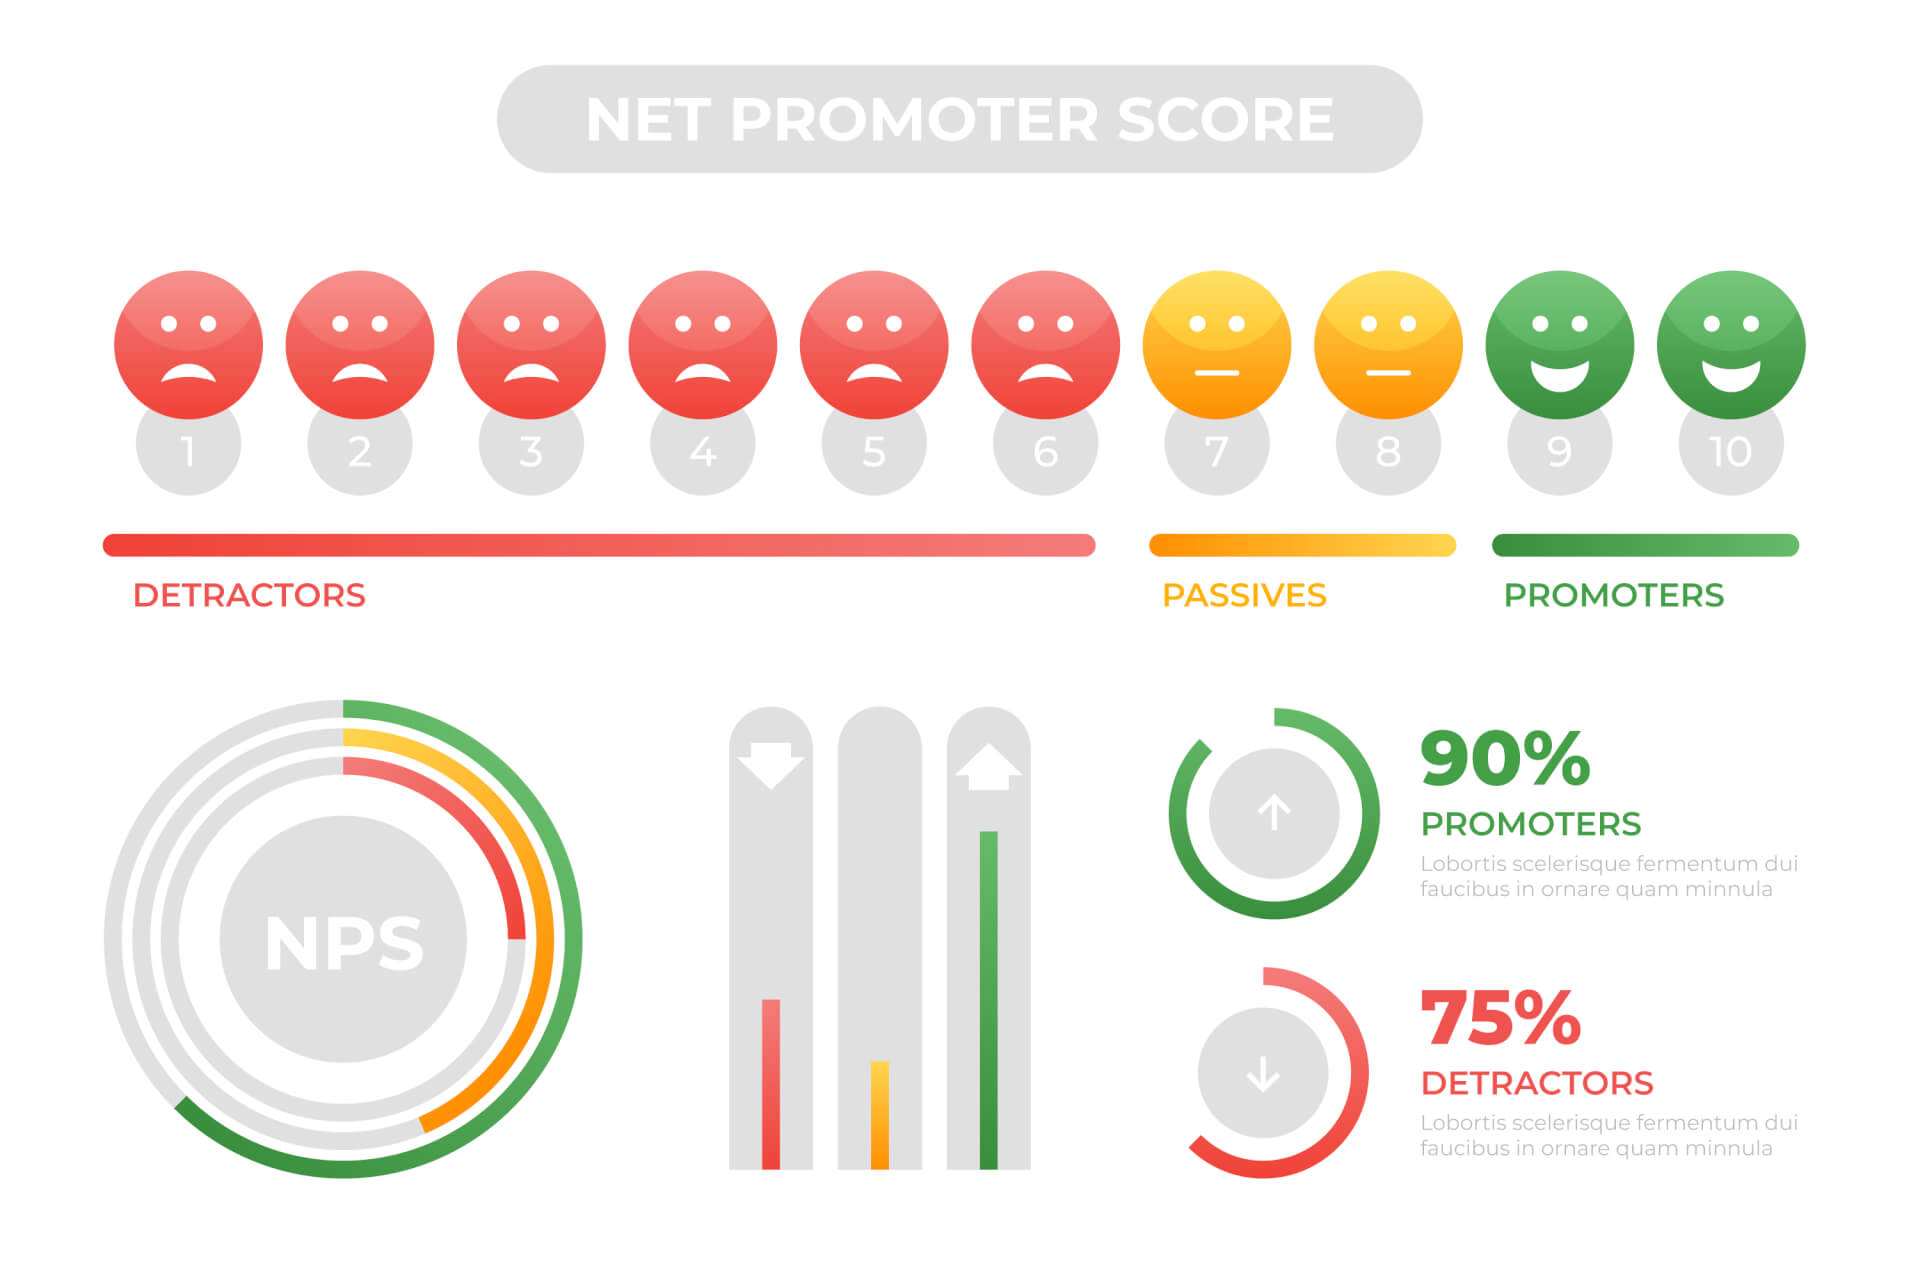
 As a first step, let's look at the NPS score. If your overall NPS score is below 0, there is definitely cause for concern, as the result clearly shows that your customer base consists more of dissatisfied detractors than satisfied promoters.
A score between 0 and 30 allows for a little more relaxation. The value indicates that your customers are basically satisfied but not yet enthusiastic about your company. There is still a lot of room for improvement here.
Reaching a global NPS score between 30 and 70 points is a good sign. The majority of your customers are very satisfied with your company.
With an NPS score of 70 and higher, you can sit back and relax. The value clearly shows that your customer base consists of many promoters who stand behind your company and will always recommend it to friends and acquaintances, as well as in social media.
Important: In this context, please keep in mind that the score is volatile, since the value always depends on the number of customers who actually took part in the survey. Also note the different factors related to the industry you work in, the scale listed above can vary greatly.
 Recommended reading: Our specialist article "How to effectively read your NPS" explains how you can understand and evaluate the collected NPS data.
Take a close look at the NPS distribution
 Why you should take a closer look at the distribution is best explained using an example. Let's say you run a company with multiple locations. You conduct NPS surveys for each location. And each location achieves the same NPS score.
Have both locations actually achieved the same result, or can planned measures be used to further increase satisfaction for both locations?
No. For example, one location can have more promoters than the other locations, which in turn have more passive customers and fewer critics.
Although the locations achieve the same NPS - overall score, the necessary measures that are necessary to further increase the customer experience would be very different here.
If you mainly work with customers in the B2B area, you should also take a closer look at who answered the surveys.
From this it can be discussed whether your service is mainly used and valued by employees or department heads. Adjust your surveys accordingly to get the most out of your survey.

Reading recommendation: On the way to the optimal NPS survey, we recommend our article “Why asking the right questions in NPS surveys is so important”
Determine the best channels for your survey.
Callexa NPS surveys are generally conducted through the following channels:
- Email NPS
- In-App (Web) Polls
- Text messages (external SMS service)
- Widgets
Depending on the offer, industry and company size, the various channels have advantages and disadvantages.
Adapt the channels to your target group and always make sure to use the appropriate channel for the survey.
The background here is that the right channel depends heavily on the position in the company and age. If you adapt the survey to this, the willingness to take part in the survey increases enormously.
With this form of segmentation, you can ensure that the survey is only sent to customers via the means of communication that interest them.
The Callexa system for reporting and statistics provides a good insight into this matter. The key metrics to consider are survey response and survey result rates.
Put the focus on customer loyalty
 To do this, you need to take a very close look at your customers.
Find out which customers are most engaged with your surveys, how often these customers take the surveys and who exactly is providing the feedback.
Then target the customers with the most interactions, and you'll find it easy to turn them into enthusiastic brand ambassadors. But also note the customers who react little or not at all to your surveys and try to find out more about the reasons for this. Most of the time, these customers are not dissatisfied at all. Is the survey possibly being sent through the wrong channel?
Or does the survey only reach an employee who does not deal with your product or service at all and therefore has no connection to it?
If you survey your customers at different touchpoints via various channels, it is important to take a closer look at the response rate and to determine which survey is answered most frequently by a customer.
Are there channels that the customer prefers? Or even others that he completely ignores?
This research will help you understand what the customer's preferred survey channel is. Once you've identified that, you can ensure your surveys only come through channels that the customer feels most comfortable with.

Recommended reading: Our blog article "6 NPS Best Practices: Elevate Your Customer Experience Strategy" aims to provide comprehensive insights into the best practices for using NPS to improve your customer strategy.
Conduct a sentiment analysis
Response sentiment analysis helps you identify potential problems or skewed NPS data. It also helps prioritize the feedback you receive. If a promoter replies with negative feedback, this needs your immediate attention. You can only avoid losing this long-standing customer if you act in good time.

Reading recommendation: In our blog article we answer the question “What value does one have a good Net Promoter Score?”
Do a text analysis
 Don't limit yourself to just looking at the achieved NPS value. Conduct an analysis using specific terms and keywords.
Callexa helps you with this, on the one hand with the TAG function provided, which you can use to have specific keywords/terms rated directly; and on the other hand via the detail and keyword search, with which you can search all answers for specific terms.
The text analysis performed as part of the NPS surveys will help you identify common customer problems by grouping feedback into subject areas (tags). This allows you to see directly where you need to take action to eliminate problems and make your service or products even more attractive and appealing to your customers.
Take the feedback analysis seriously and act on it

Companies looking to build long-term customer relationships are increasingly relying on NPS-based customer satisfaction surveys to measure and improve customer experience.
NPS surveys can help you gain many helpful insights into how your customers really feel about your brand.
But simply collecting customer responses is not enough; It is critical that you understand and act on all feedback.
Once the weak processes are identified, companies need to close the feedback loop with an immediate response to ensure the uncomfortable situation is exchanged for a positive experience.
Likewise, you should share any information gained during the NPS data analysis with all relevant departments in your company. Ideally, everyone should know exactly what your customers think of your services and/or products.
Some NPS services give you the option to directly involve your colleagues in the NPS process by giving them access to your campaigns. You can turn customer feedback into tasks or follow-up reminders for your colleagues and track progress without leaving the platform.
Monitor customer satisfaction at every touchpoint of the customer journey.
 You already know that an NPS survey can provide accurate data on customer satisfaction, but did you also know that you can segment this feedback according to a certain phase of the customer lifecycle? At its core, it's about seeing what the average customer satisfaction rating is up to a certain point in time, and using that information to better tailor and personalize your further customer satisfaction campaigns.
Once you have enough customer data, you can start setting up campaigns for each stage and even automate the process to some degree. Also, the feedback received can be used to better customize the survey templates, for example by personalizing the NPS score and open-ended questions to match each stage.
For example, once you understand your passives better, you can set an NPS survey to trigger whenever a specific event occurs. By sending out an NPS survey at every stage of the customer lifecycle, you can see exactly how satisfied they are with using your product. You will also learn how to improve their experience and in which phases there is the highest risk of churn.
 Reading recommendation: Our blog article “The influence of NPS on sales and growth” deals with the direct influence of your customers’ satisfaction along the touchpoints.
Check what engagement metrics your customers define
 Link your promoters, passives, and detractors to engagement metrics.
If you can figure out which of your webpages your promoters visit the most, you could place actionable CTAs (calls-to-action) on them to get even more engagement from them. The same logic can be applied to detractors or passives, as you could place a well-timed popup message giving them a discount or a sneak peak at an upcoming feature.
Additionally, by figuring out what most of your detractors and/or passives have in common when it comes to online behavior, you can reduce customer churn by taking appropriate action.
The detailed evaluation of the collected NPS data helps you to recognize patterns in how detractors, promoters or passives use your product.
This helps you spot dissatisfied customers before they churn and allows you to engage with them and learn how you can improve their experience.
NPS analysis made easy - with Callexa
Businesses deal with data all the time; However, raw data is not revealing if it is not properly organized.
The challenge is to figure out how the information gathered can address existing problems and make the company visible.
Accurate survey analysis can give you many insights into the mindset of your customers. The problem, however, is accessing all this information at the same time.
With Callexa, you can easily run NPS campaigns across multiple channels, customize the templates to make them more engaging, and retrieve all post-campaign data.
Feel free to contact us for a demo, or book our free tariff "Free" today and convince yourself of the advantages of an NPS-based customer satisfaction survey.
Reading recommendation: If this article helped you and you would like to find out more about the Net Promoter Score, continue reading here: “The Net Promoter Score – Basics and Areas of Application”