Click on "Statistics" in the top navigation bar. In the filter bar select one or multiple surveys or leave the field empty to get statistics from all your surveys.
In the select box right next to the filter bar, chose from predefined periods grouped by monthly, quarterly or yearly beginning with your account creation time.
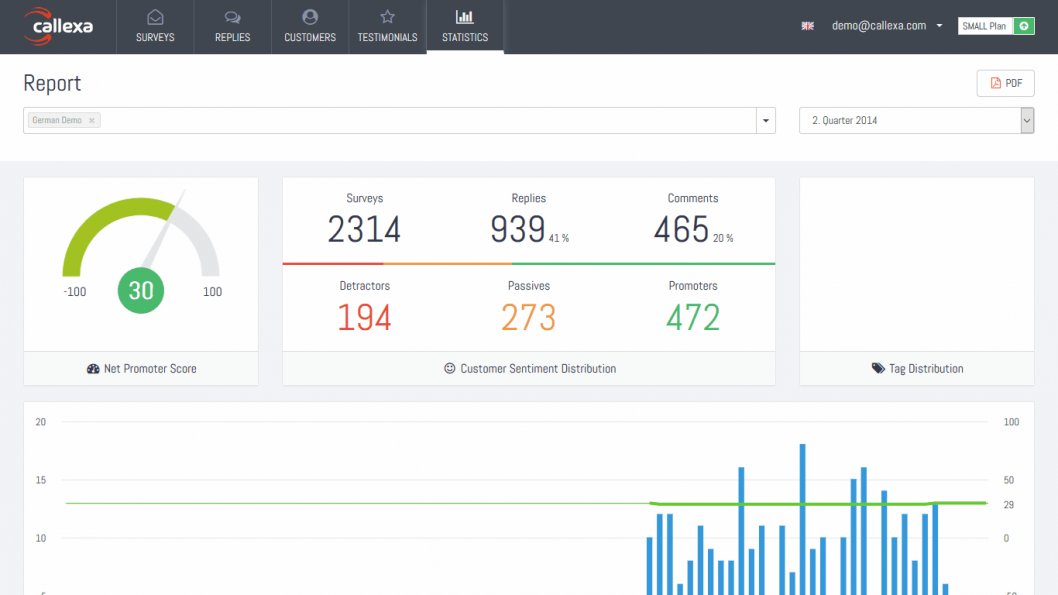
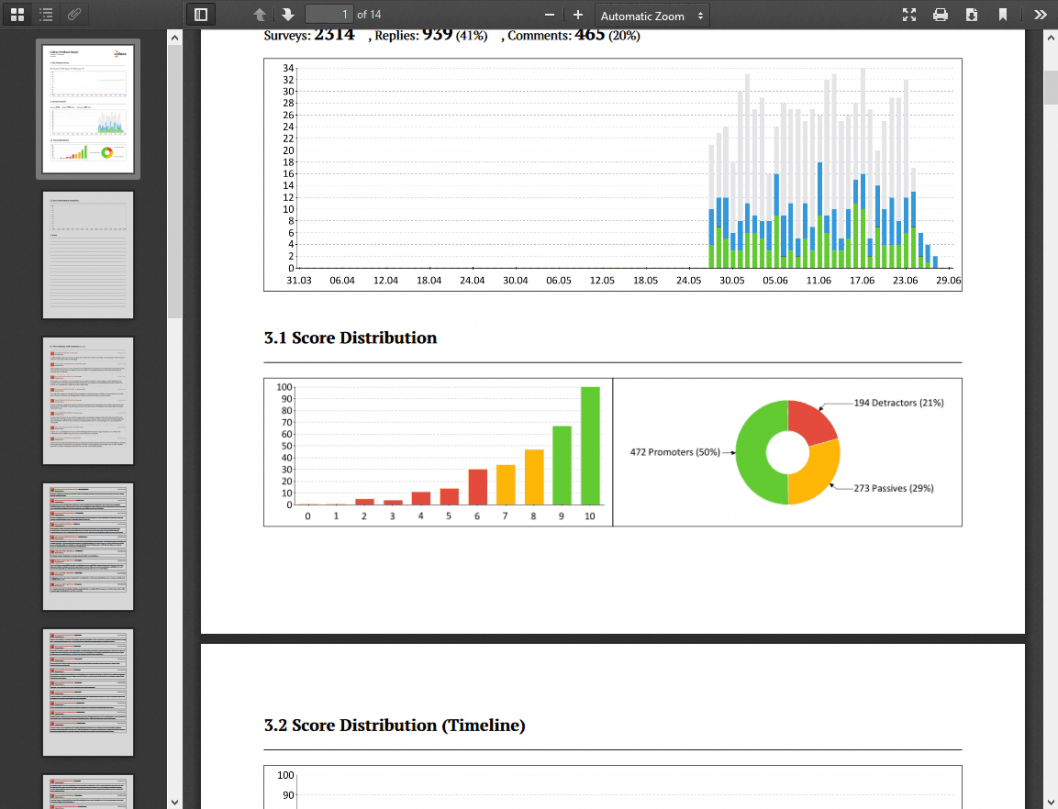
Now click the "PDF" button top right and a report for the selected period and surveys is generated. This can take a few seconds to complete.
The report includes the charts as displayed in your account dashboard, a tag scale plus the best and worst (max 50) commented ratings received in the selected period.
In your account settings (click on your email address in the navigation bar and select "Settings") scroll down to the "Notifications" section and select a period for the "Summary report". Either monthly or quarterly.
It is possible to define one or multiple (separated by a semicolon) alternative email addresses to send the report to.
The PDF is automatically generated and attached to the report email.
Reading recommendation: Now that you know how to create and load your PDF reports, it is important to interpret the NPS analysis correctly. We recommend our blog article: “How to effectively implement NPS data analysis”
Unlock the secrets to customer loyalty with our comprehensive guide on NPS survey design. Learn to craft questions that deliver insightful responses and drive business success!
Benchmark Email is a global leader in email marketing. Benchmark puts the online marketing tools you need right at your fingertips, allowing you to connect and engage with customers new and old at every level. Take powerful features by the dozen, sophisticated list management, hundreds of email templates, ultra-precise reports and dazzling email and video email.
Sometimes customers don't understand the scale of NPS and give you a wrong evaluation. To give your customer the opportunity to correct this we have integrated a function to resurvey the customer.
Datadog is a SaaS-based monitoring and analytics platform for IT infrastructure, operations and development teams. It brings together data from servers, databases, applications, tools and services to present a unified view of the applications that run at scale in the cloud. See across systems, apps, and services. Datadog gathers performance data from all your application components.
Envoy simplifies sign-in at your busy front desk: When visitors sign in on the iPad, you’re free to focus on the person rather than the paperwork. Plus, Envoy automatically prints badges and alerts employees when their guests arrive, so you’re free to do more meaningful work.
Bigcommerce delivers a wealth of securely hosted e-commerce tools, including a shop system with over 100 unique features, product catalogs, payment gateways, email accounts, marketing tools, and in-depth reports. With the search engine optimization (SEO) of Bigcommerce your shop ranks higher in search results.
Team collaboration, client feedback, and task management designed for web projects. Your clients report issues by making annotations right from the site being worked on. BugHerd turns these into full bug reports with all the info you need to fix the problem.
In our today's edition of Callexa Feedback Integration series we want to introduce the service SupportBee closer.SupportBee is designed to get everyone in your company involved in customer support. Manage emails for all departments, or even various brands within an organization from a single inbox in SupportBee.
With Callexa Fedback, you can send customer satisfaction surveys with the NPS system. The actual sending of the NPS survey is relatively easy thanks to Callexa feedback. However, if the survey is sent at the wrong time, this can have a negative impact on the ratings.